
Problem: You’re drowning in signals and still getting bad parts
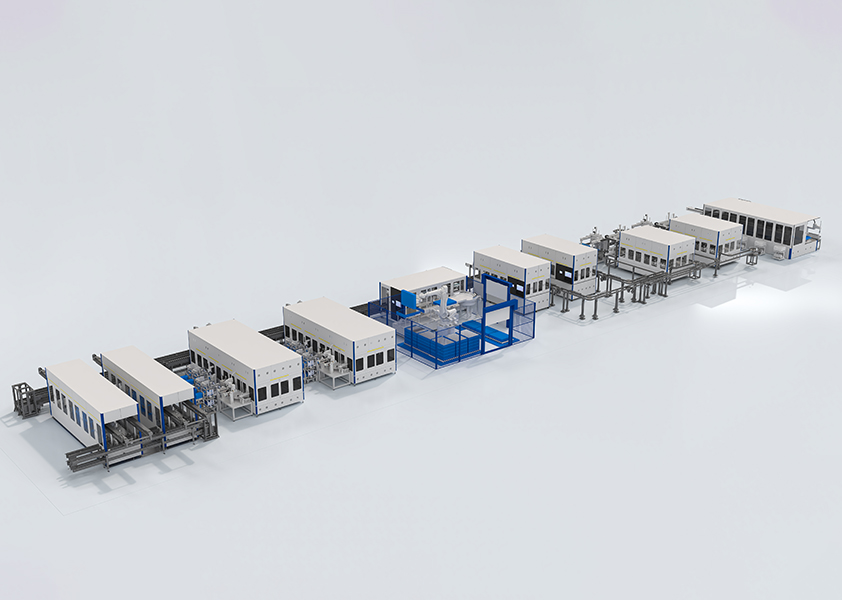
Lines throw off a ton of data, and if you don’t pick the right bits to watch you’ll keep getting surprises: rejects, rework, and late-night firefights. Start simple. Watch the things that tell you a machine’s doing the job right or it’s not—no fluff. For teams used to hands-on fixes, pairing solid sensors with clear rules beats guessing every time. That’s why folks working with battery manufacturing automation focus on a few hard signals first: quality hits, machine stops, and material traces.

What to track — the core signals that actually root out problems
– Cycle time per station (not averaged over an hour; per part).
– Reject / defect type and timestamped images (vision pass/fail with the frame saved).
– Torque and force traces for joins and fasteners—look for drifts, not just failures.
– Environmental readings tied to batches: temperature and humidity where they matter.
– Component lot IDs and full traceability for every finished unit.
– Machine state changes and categorized downtime codes (manual, setup, fault).
– Consumable usage and changeover counters (filters, heads, cutters).
– Nonconformity frequency by operator or shift—people patterns show up fast.
Where the data should come from — practical sensors and sources
Use the obvious hardware: torque transducers, vision systems, thermal cameras, impedance or electrical checks, barcode/RFID readers, and the PLC’s event log. Put timestamps on everything and sync clocks. On battery lines you’ll want cell-level electrical checks feeding the same trace record as the assembly steps—don’t let pack tests live in a separate silo. Integrate operator inputs (yes/no confirmations) but don’t let manual entries be the only truth.
One real-world anchor — a quick reminder from a big install
At the Nevada Gigafactory-style builds, teams learned that tracking per-cell electrical checks alongside torque profiles cut down thermal rejects faster than any checklist ever did. That kind of hard pairing—mechanical plus electrical—catches problems before the final test room.
Common pitfalls that make your data useless
– Too many alarms: they tune out the crew. Set priority levels.
– Loose timestamps: if logs don’t line up, you can’t map cause and effect.
– Siloed systems: vision in one server, traceability in another—link them.
– Over-filtering data: smoothing hides early drift. Keep raw traces for a window.
– No ownership: if nobody acts on an alert, tracking becomes noise.
How to act on the signals — rules that stop problems, not just report them
Turn metrics into actions: short control limits for immediate rejects, wider warning bands for maintenance triggers. Route critical alarms to the right technician and attach the last 10 seconds of sensor traces and an image. Use quick root-cause checks that a shop crew can run in five minutes. Fix the process, not just the failed part—adjust feeders, re-torque, replace a worn punch. Real experience on the line beats theoretical dashboards; technicians and engineers must see the same screen and speak the same language.
Quick rollout checklist for a working monitoring setup
– Pick the three metrics that predict your worst failures and instrument them first.
– Sync clocks, standardize event codes, and enforce structured operator inputs.
– Store the last-minute trace with every defect image.
– Create short action playbooks per alarm (who does what in 5 minutes).
– Review the data weekly with the people who run the machines, not just managers.
Wrap-up: what fixing the problem actually looks like
Sort the mess by tracking the right signals, tying them together, and making fixes fast and specific. Do that and rejects drop, setups get cleaner, and night calls stop piling up. That’s the kind of practical, shop-floor progress teams see when monitoring is done right—solid work that FHS helps fold into customer operations without the smoke and mirrors.