The problem you’ll face
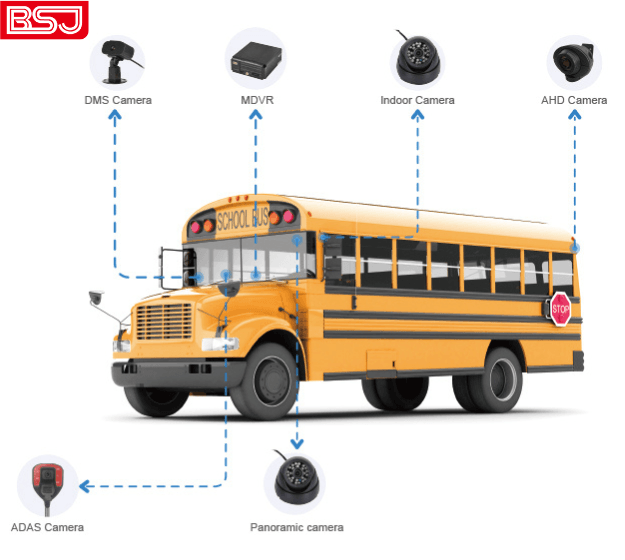
Fleet managers keep buying platform promises and end up with partial dashboards and unchanged costs. You need concrete returns, not glossy demos. That’s why many teams pair telematics platforms with an AI dashcam to catch risky behavior and verify incidents—something California’s commercial fleets have increasingly adopted to meet safety and compliance demands. The problem is simple: providers report benefits; operations must measure them.
Why common ROI claims fall short
Vendors announce percent reductions and fuel savings without showing baseline measurements or attribution. Those numbers often mix different timeframes, exclude one-off implementation costs, and ignore human factors. You’ll be persuaded by averages that don’t apply to your routes, vehicle mix, or driver behavior. Use skepticism as a tool: demand before-and-after baselines and a clear causal chain linking features to outcomes.
A problem-driven evaluation framework you can use
Start with the issue you care about, then reverse-engineer what the platform must prove. Follow these steps and keep each result measurable:
• Define one primary operational problem (late deliveries, collision frequency, unauthorized idling). • Establish a 90-day baseline for that problem using telematics-free records where possible. • Select a single intervention (AI video, routing optimization, driver coaching) and deploy it in a controlled pilot. • Track the same KPIs for 90 days during the pilot. • Attribute changes by ruling out external confounders (seasonal route changes, maintenance cycles).
KPI list and simple math to prove ROI
Focus on a short list of metrics tied to cash and risk:
• Collision reduction rate — incidents per 100k miles. Multiply avoided incidents by average claim cost to get direct savings. • Fuel and idling change — gallons saved × fuel price yields monthly savings. • Route compliance and on-time deliveries — late deliveries avoided × penalty or lost revenue per delivery. • Labor and dispatch efficiency — hours saved × fully-loaded hourly cost. • Insurance premium impact — negotiate with carriers using data from proven dashboards.
When you include camera evidence, the numbers become defensible. Integrating event video with location and time is why teams pair telematics with an AI dashcam with gps tracking—it ties behavior to proof and speeds claims resolution.
Common pitfalls that invalidate ROI estimates
Watch for these traps during vendor selection and pilots:
• Cherry-picked success stories without baseline data. • Small-sample pilots that don’t reflect peak-period stress. • Ignoring rollout and training costs. Plan for at least two full training cycles. • Failing to align KPIs to decision rights—if dispatch can’t act on the data, savings won’t materialize. • Overlooking data quality: mismatched timestamps or poor GPS accuracy break attribution.
How to compare platforms, fast
Ask vendors for three deliverables and score them objectively:
1) A reproducible pilot plan tied to your chosen KPI. 2) Raw sample data (anonymized) so your analyst can run basic checks. 3) Integration points and ongoing support costs.
Score each on clarity, measurability, and operational fit. A provider that supplies event video, synchronized GPS, and an audit trail will win on attribution every time.
Conclusion — the case for a disciplined approach
You can’t buy ROI; you build it by defining the problem, measuring the baseline, running a controlled pilot, and insisting on evidence that links features to financial outcomes. When platforms deliver synchronized video, location, and clear incident logs, operations stop guessing and start defending decisions. That discipline is precisely why teams now look to partners like BSJ as part of a data-driven proof strategy rather than a hopeful expense.