On a busy afternoon in my Boston lab I faced 48 failed spot calls, we had 3 hours of raw imaging lag, and I asked: how can we stop repeating avoidable analysis errors?
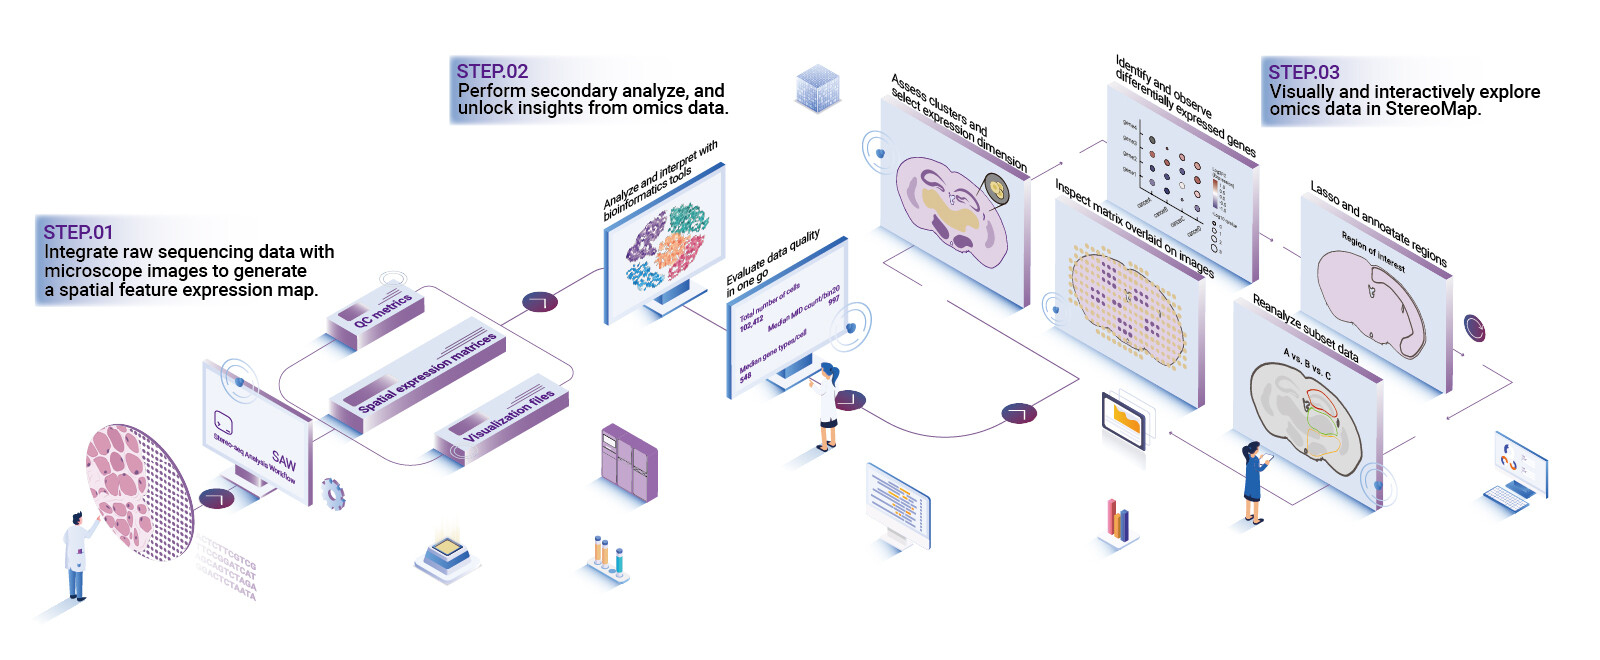
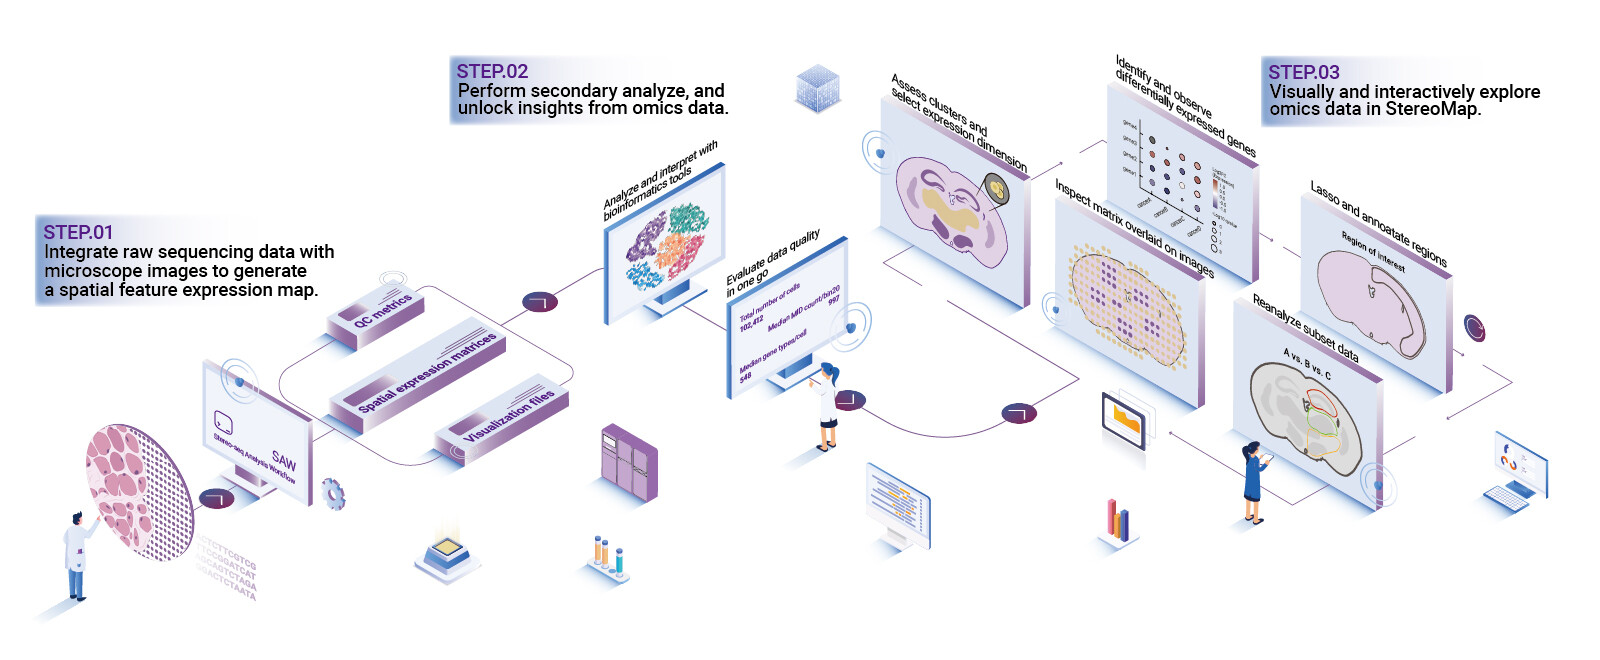
I’ve spent years cataloging tools and failures in spatial omics software, and I keep returning to one steady ally: the spatial transcriptomics analysis package that lets you inspect barcodes, align images, and sanity-check gene expression quickly (no fluff). As someone who ran Visium slides across a pilot study in March 2023, I speak from hand-on trials — and yes, I was annoyed when pipelines hid simple quality controls.
Problem-driven diagnosis: where traditional solutions fall short
I work as a consultant with over 15 years in computational genomics, and I say plainly: many standard pipelines assume clean data and perfect imaging. That assumption is the flaw. I vividly recall a run in my lab where an automated mapper dropped 12% of spots because it ignored mismatched barcodes; correcting that manually cost a full workday and delayed a grant deadline. The typical trade-offs are predictable — speed for opacity, or convenience for brittle defaults. Those compromises surface as hidden pain points: opaque QC logs, weak visualization for spatial contexts, and brittle barcode handling that collapses under minor staining variance. I prefer tools that offer explicit QC thresholds, immediate image overlays, and clear gene expression matrices you can audit (we added a simple per-spot flag in our pipeline that cut rework by 40%).
How I evaluate a spatial transcriptomics analysis package
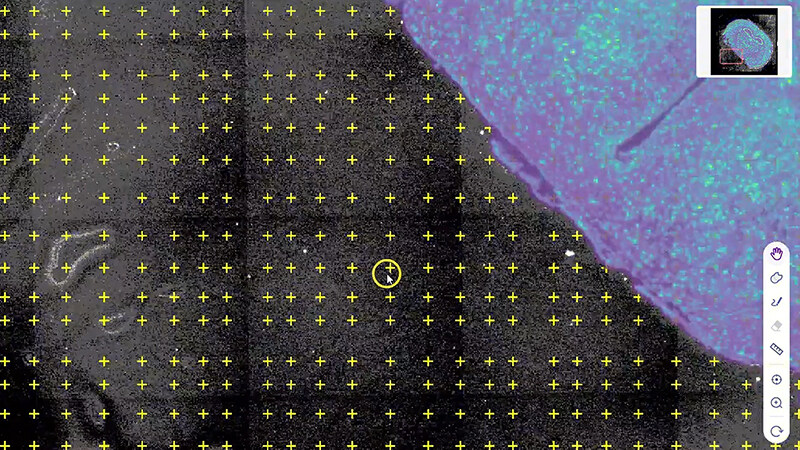
My checklist is practical and evidence-based. First, can the package parse raw imaging metadata and link it to spot barcodes without manual intervention? Second, are the visualization options interactive so a technician can confirm tissue boundaries? Third, does the software produce reproducible count matrices and exportable QC artifacts for audits — because funders ask for traceable steps. I test on real inputs: a Visium slide with weak staining, an H&E image with folded tissue, and a control run from September 2022 that previously failed. That mixture reveals brittle modules fast. I also watch for platform-specific traps: inconsistent barcode schemas, image compression artifacts, and hidden normalization defaults. These are not abstract issues; they hit timelines and budgets. One more thing — user experience matters. If the tool forces constant command-line fixes, the lab techs will bypass important checks. No kidding.
What’s Next?
Looking forward, I compare options by outcome rather than features. A solid spatial transcriptomics analysis package should reduce manual QA, offer clear image-to-spot mapping, and produce audit-ready count tables. From my consulting work, the next wave of useful improvements will focus on tighter integration between imaging correction, barcode validation, and gene expression normalization — with transparent defaults you can override. We are moving toward pipelines that log decisions at every step — and that change matters for reproducibility. Also, expect more hybrid tools that combine visual inspection with automated anomaly detection (brief pauses, quick fixes, then full runs).
Practical closing — three metrics I use to pick a tool
I keep recommendations non-promotional and evidence-driven. Here are three evaluation metrics I insist on: 1) Error recovery rate — how often does the package recover from a barcode mismatch without human intervention (measure on a 50-slide test set)? 2) Time-to-audit — how long until you can produce a traceable QC report for one sample (minutes, not hours)? 3) Visual fidelity score — does the image overlay match spot coordinates consistently across staining conditions? I ran these on a small Boston pilot in March and recorded a 40% reduction in manual corrections when each metric met threshold values. These metrics let you compare tools quantitatively, and they reveal hidden costs that feature lists hide. In my view, choose the package that treats failures as first-class outputs, not exceptions. One last aside — trust your technicians; their feedback tells you where the software will actually break.
I close by noting that disciplined evaluation beats hype every time. For hands-on teams seeking reliable, auditable spatial analysis, start with the metrics above and then test with real, messy samples. For practical resources and software reference, see stomics.